
Posted by: Malcolm Jarvis
During the course of a shift, the Greenlight call centre solution is constantly busy managing calls, tracking agent activity, keeping call lists topped up, placing call backs and much more. The Agent Activity screen, accessible by team leaders and managers through the Agent Console or portal, gives you a window into what’s going on within your system in real-time. Unlike the Greenlight wallboard system, which is fully customisable, the content of the Agent Activity page is the same for all campaigns, so yours will look a lot like the image below: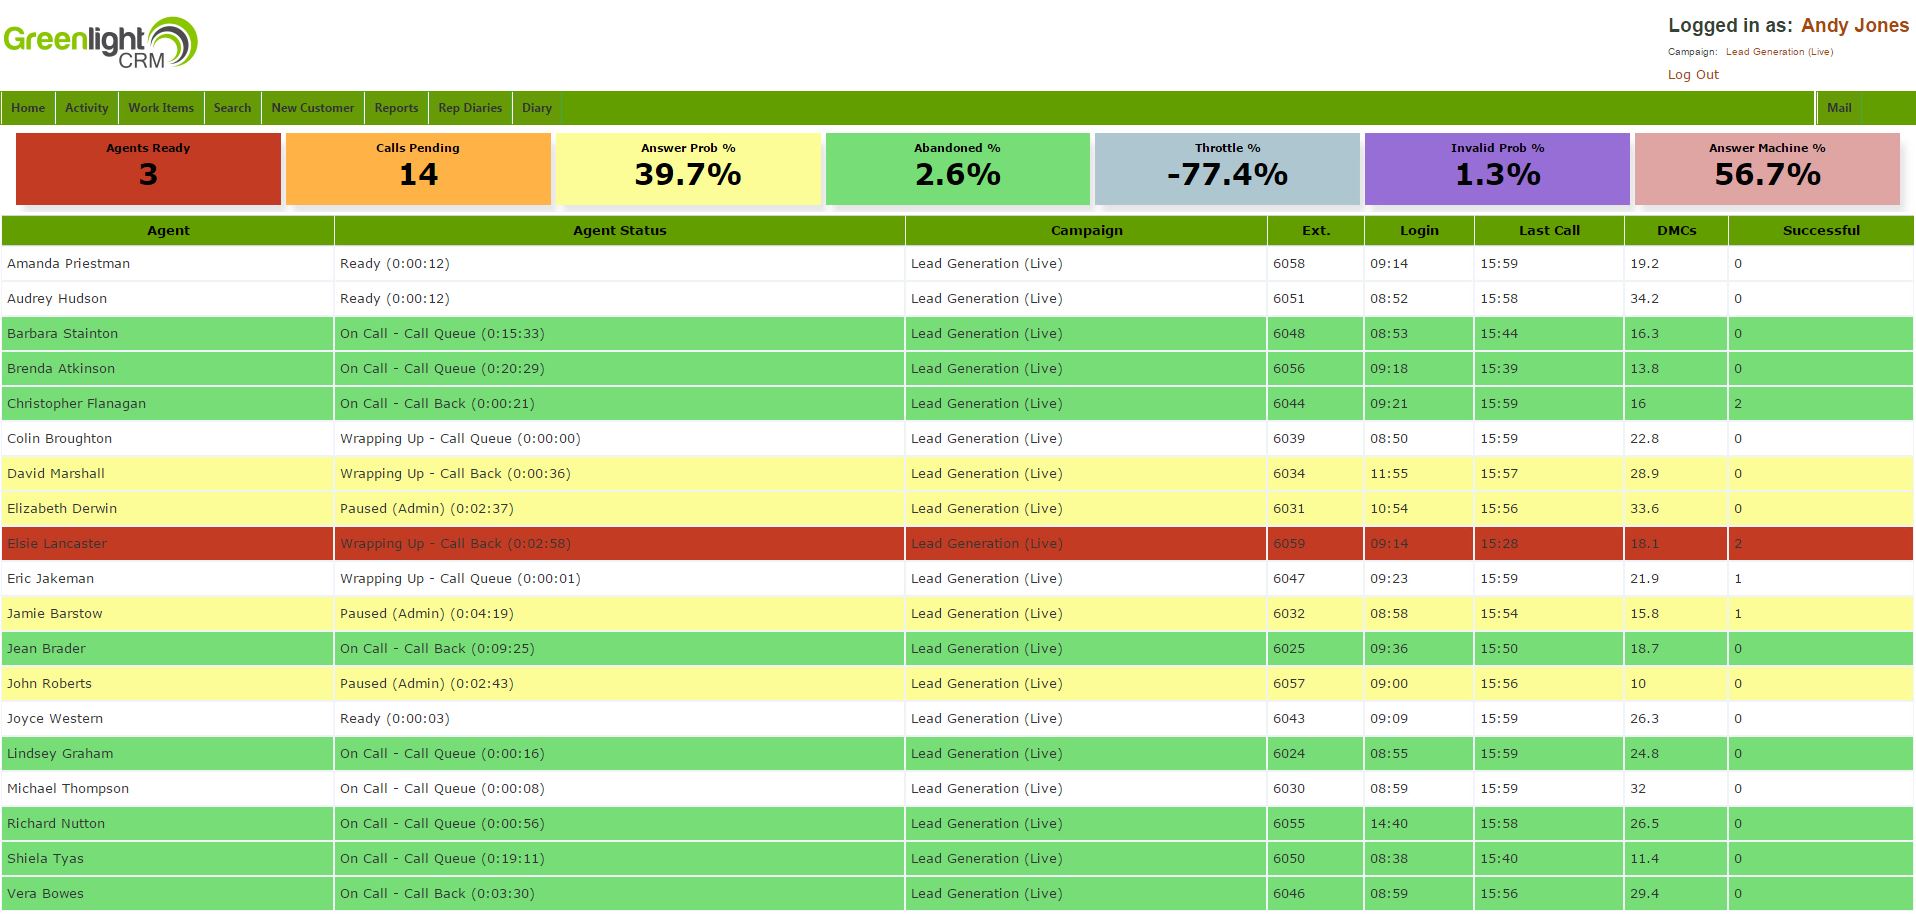
The top row of numbers always relate to the predictive dialler engine for the campaign you’re currently logged into. Managers can vary the agents that are included in the lower part of the screen, while team leaders can only ever see activity for members of their own team.
As you can see, we seven different stats along the top of the screen which tell you a lot about how the system is currently performing. These are constantly being updated as the system calculates the optimum dialling rate for your campaign:
Agents Ready
The number of agents currently waiting to be connected to a call.
Calls Pending
The number of calls that are currently ringing. Calls need to ring a minimum of 15 seconds, and 18 seconds is the average that’s used.
Answer Prob %
The current probability that a call will be answered based on recent answer rates for data lists that are running.
Abandoned %
The current abandoned call rate (the ratio of abandoned calls to answered calls connected to an agent)
Throttle %
The ratio that the system is currently increasing or decreasing new calls by. This will be positive if the current abandoned call rate is too high, and negative if there’s room to increase the dialling rate a little.
Invalid Prob %
The current ratio of invalid calls in the data that’s running.
Answer Machine %
The current ratio of calls that are going to answer machine in the data that’s running.
There are a number of things to look out for here. Firstly, there’s your abandoned %, which is your current abandoned call rate. Obviously this needs to end the day under 3%, but if it tips over at the beginning of a shift, don’t panic - the rule applies to calls within a 24 hour period, and as more calls connect the rate will rapidly come down to acceptable levels.
Your answer probability % and answer machine % will vary depending on the type of data that you’re dialling and the time of day. Mobiles are generally more likely to answer than landlines, especially during the day, and business numbers are more likely to answer than residential ones. Once data has been running a while, both these figures will begin to drop as the number of uncontacted numbers that will ever get answered decreases. When this happens it’s time to turn on some new or rested data to keep the system operating as efficiently as possible..
The throttle % is directly linked to the abandoned call rate. If the abandoned call rate is above the level specified on your campaign (3% is the maximum, but we usually recommend 2.8% or lower to give the dialler some breathing room), then the throttle will go up and the system will reduce the amount of new calls being placed until the ratio is back to where you want it to be.
Lastly, the invalid probability % gives you an indication of the quality of the data that you’re running. 1% is about normal, 10% indicates you’ve been supplied some very old or very bad data indeed.
One of the interesting features of predictive diallers is that the system becomes more accurate as the number of ready agents increases. This is because it allows the predictive dialler to “play the numbers” more as there’s less chance that there will be a sudden, significant spike in answered calls that catches the system out. Lower numbers of agents ready means there’s a bigger chance that a greater proportion of ringing calls will connect unexpectedly, so the system automatically reduces the ratio of new calls being placed to account for this.
Now that we have an understanding of the headline figures and what they mean, let’s have a look at the main part of the screen. As you can see, you have a row for each agent who is currently logged into the campaign, or has been logged into the campaign during the current day.
The agent status shows you what the agent is currently doing, and how long they’ve been in that status. For connected calls, you can see what the origin of the call was, and for agents currently idle or logged out, you can see the pause/logout reason that they chose if you have these configured on your campaign.
Rows for agents will be coloured green after the agent has been on a call more than 15 seconds (i.e. they’ve got past the initial greeting and are hopefully getting into their pitch), agents that have been paused or in wrap up more than 30 seconds will be coloured yellow, and rows for agents in wrap up will go red after a minute.
The extension number is useful for when managers and team leaders use the call monitoring, call whispering and call barging facilities.
DMC stands for Decision Maker Complete and shows the number of records being completed (burned) by the agent on an hourly basis. Successful shows the number of records that day that have been dispositioned with a positive outcome.
These activity stats are available as standard across all your campaigns and are a quick and easy way of checking up on how the system is performing and seeing a real-time view of your agents and can be accessed from anywhere. Just watching your system in action can be strangely hypnotic and more than a little addictive - you have been warned!